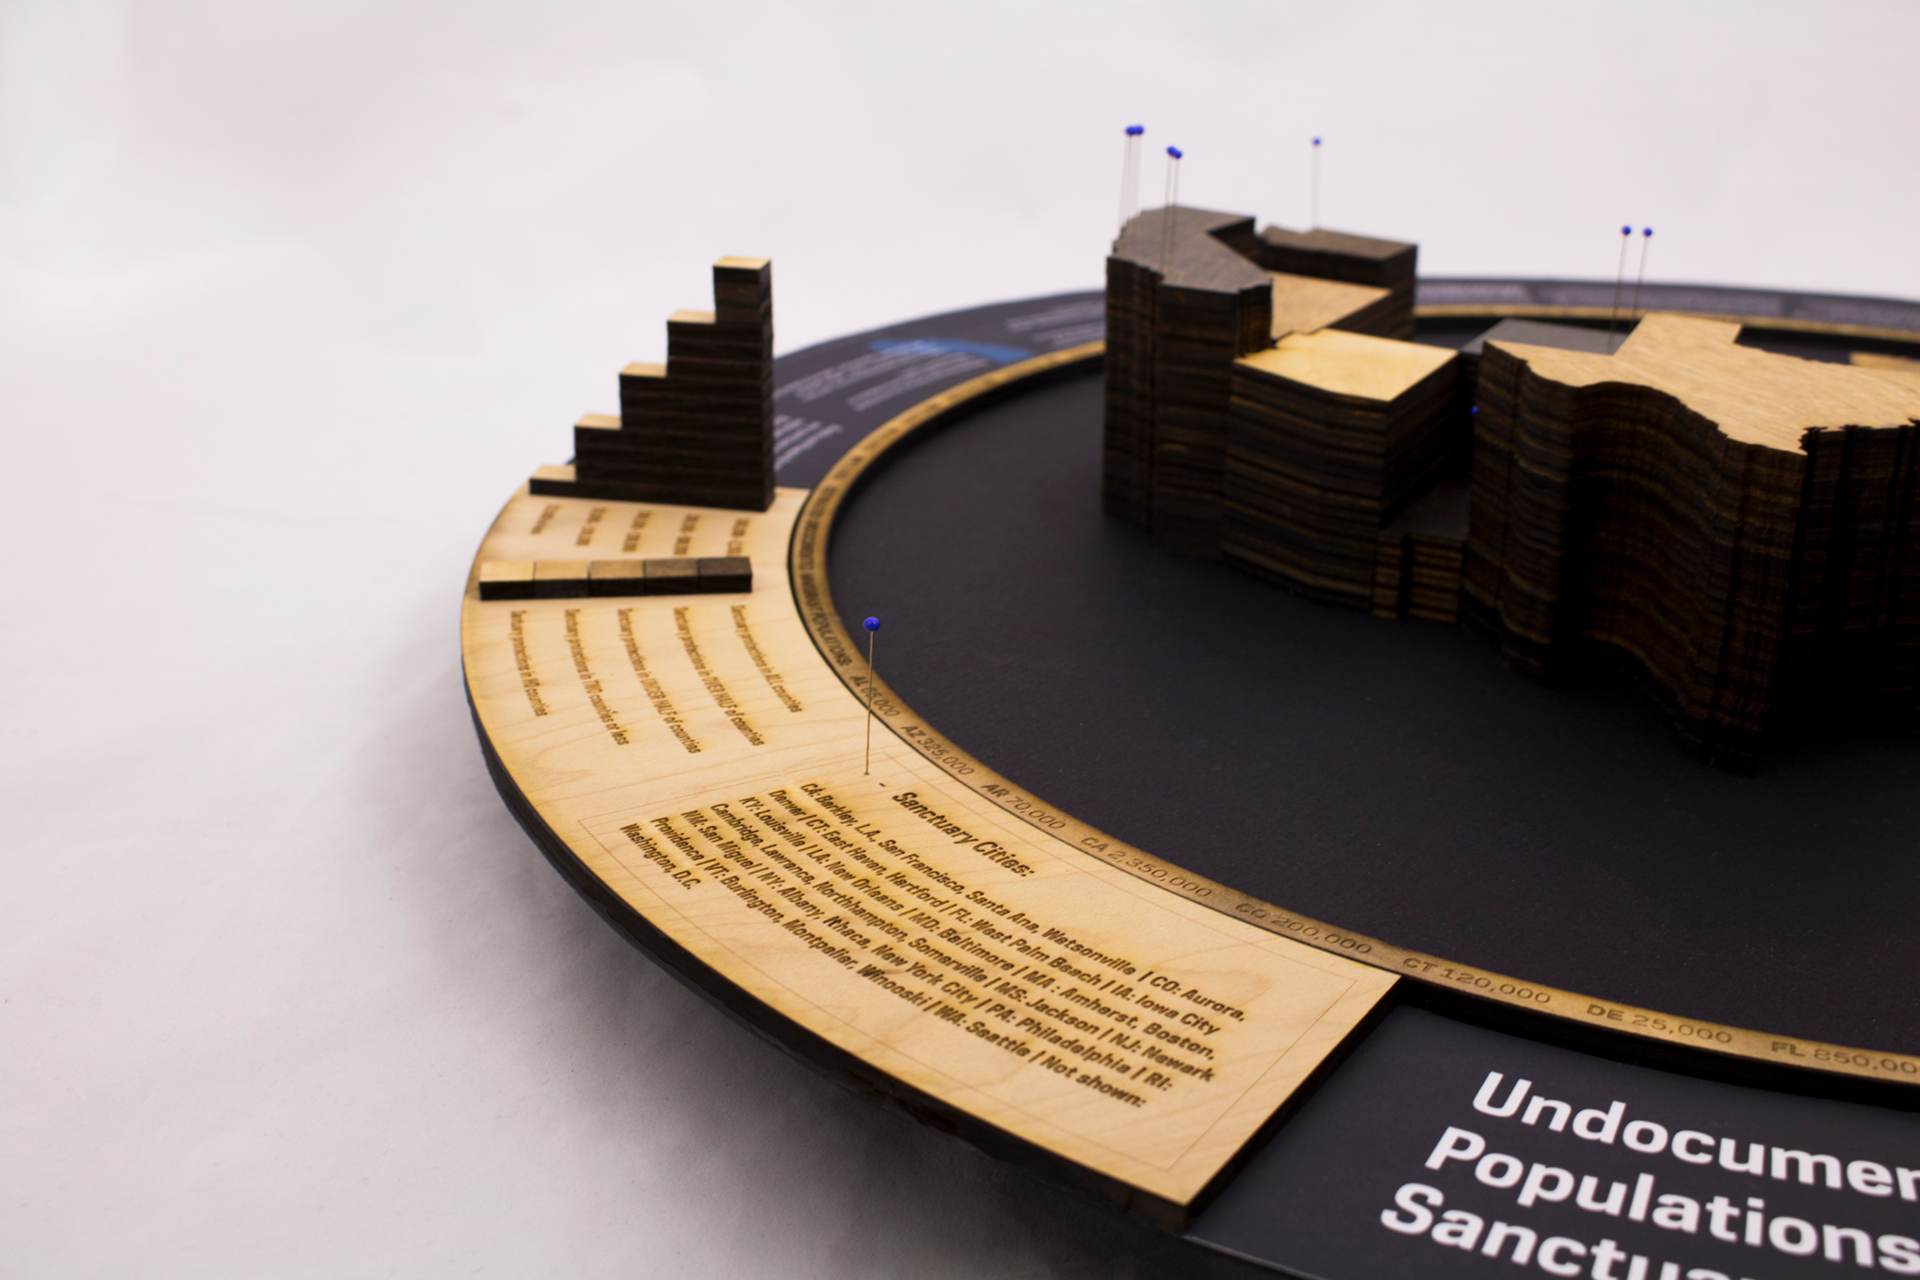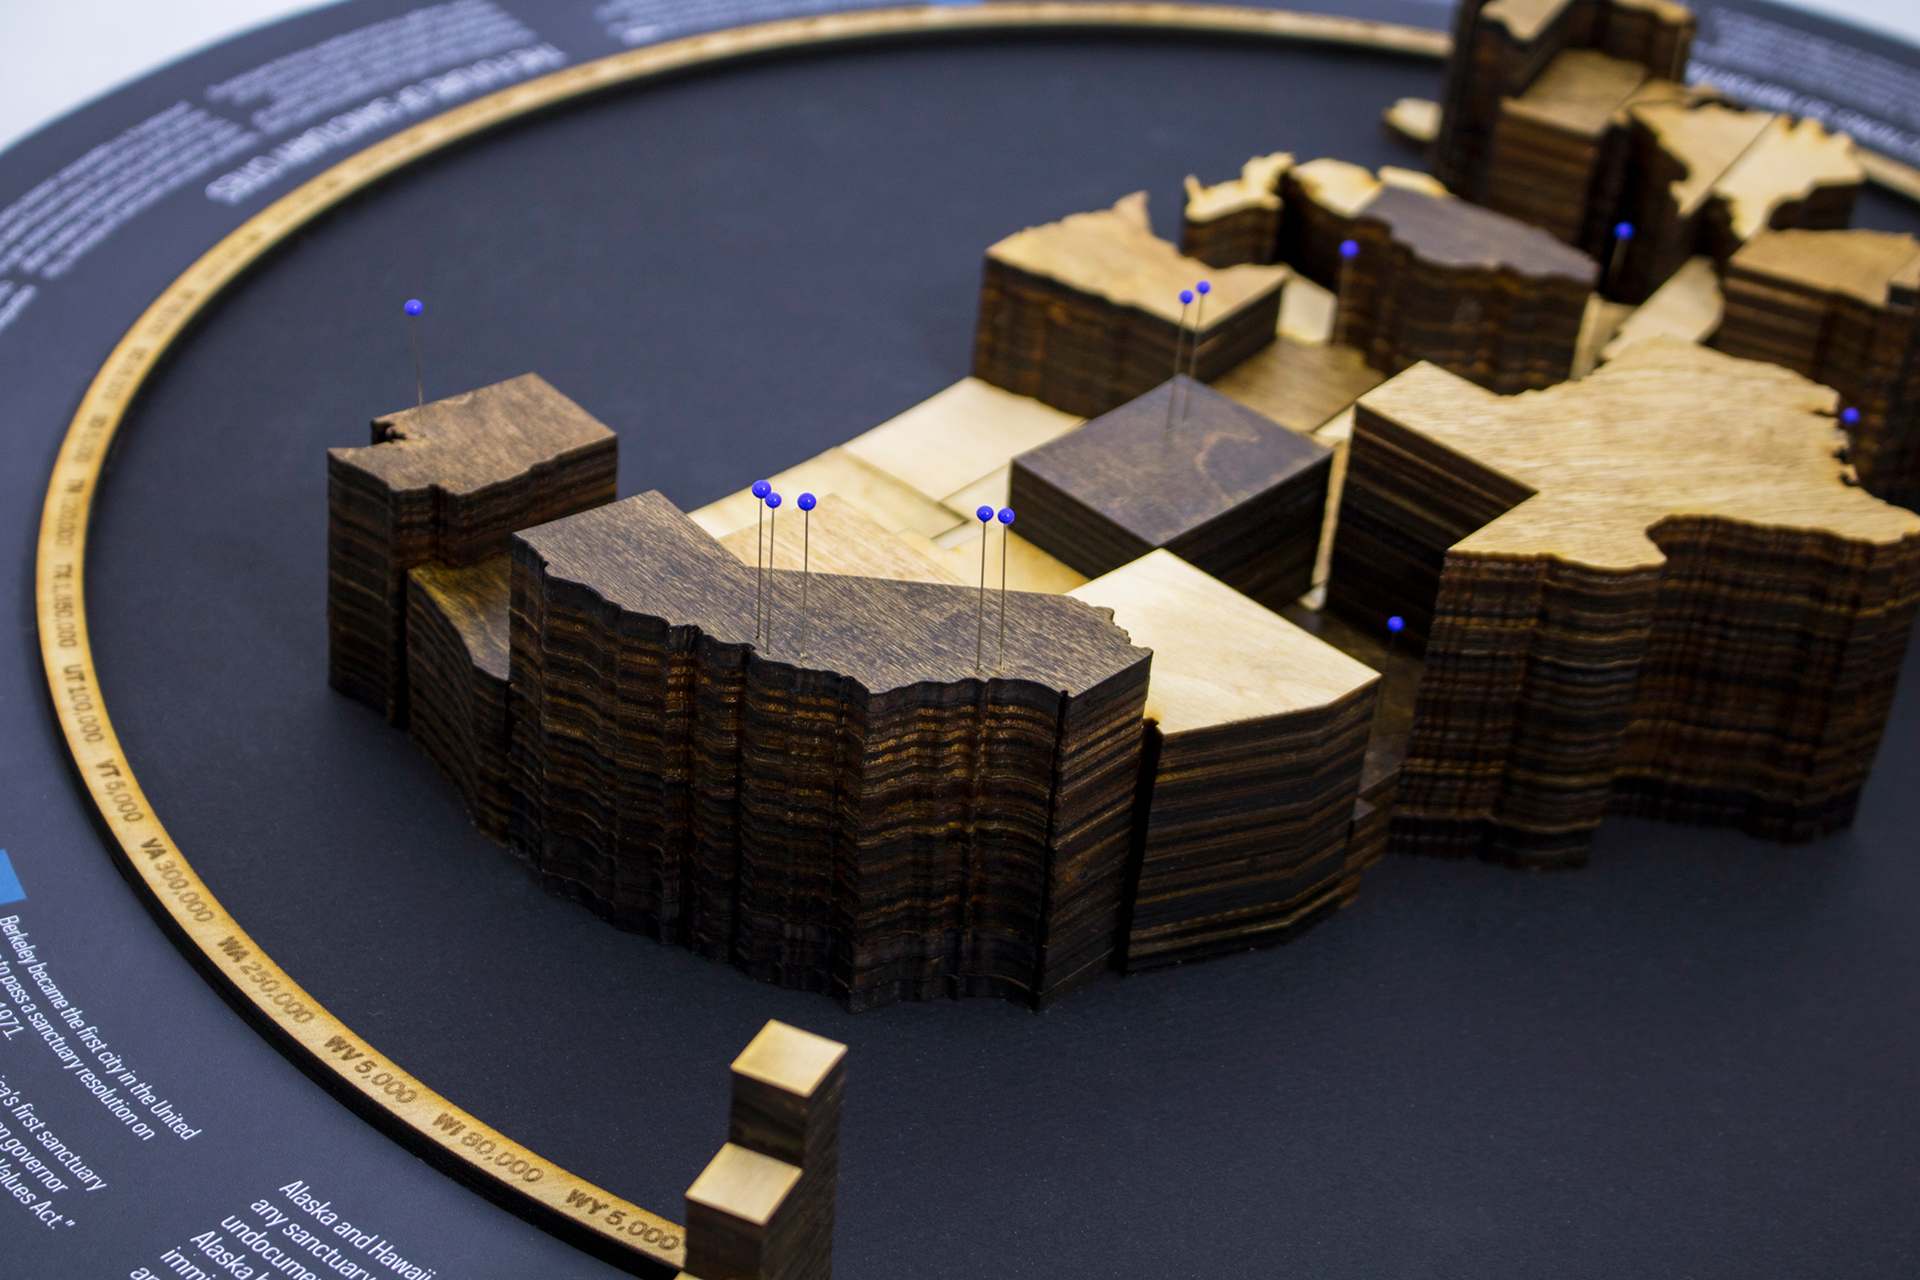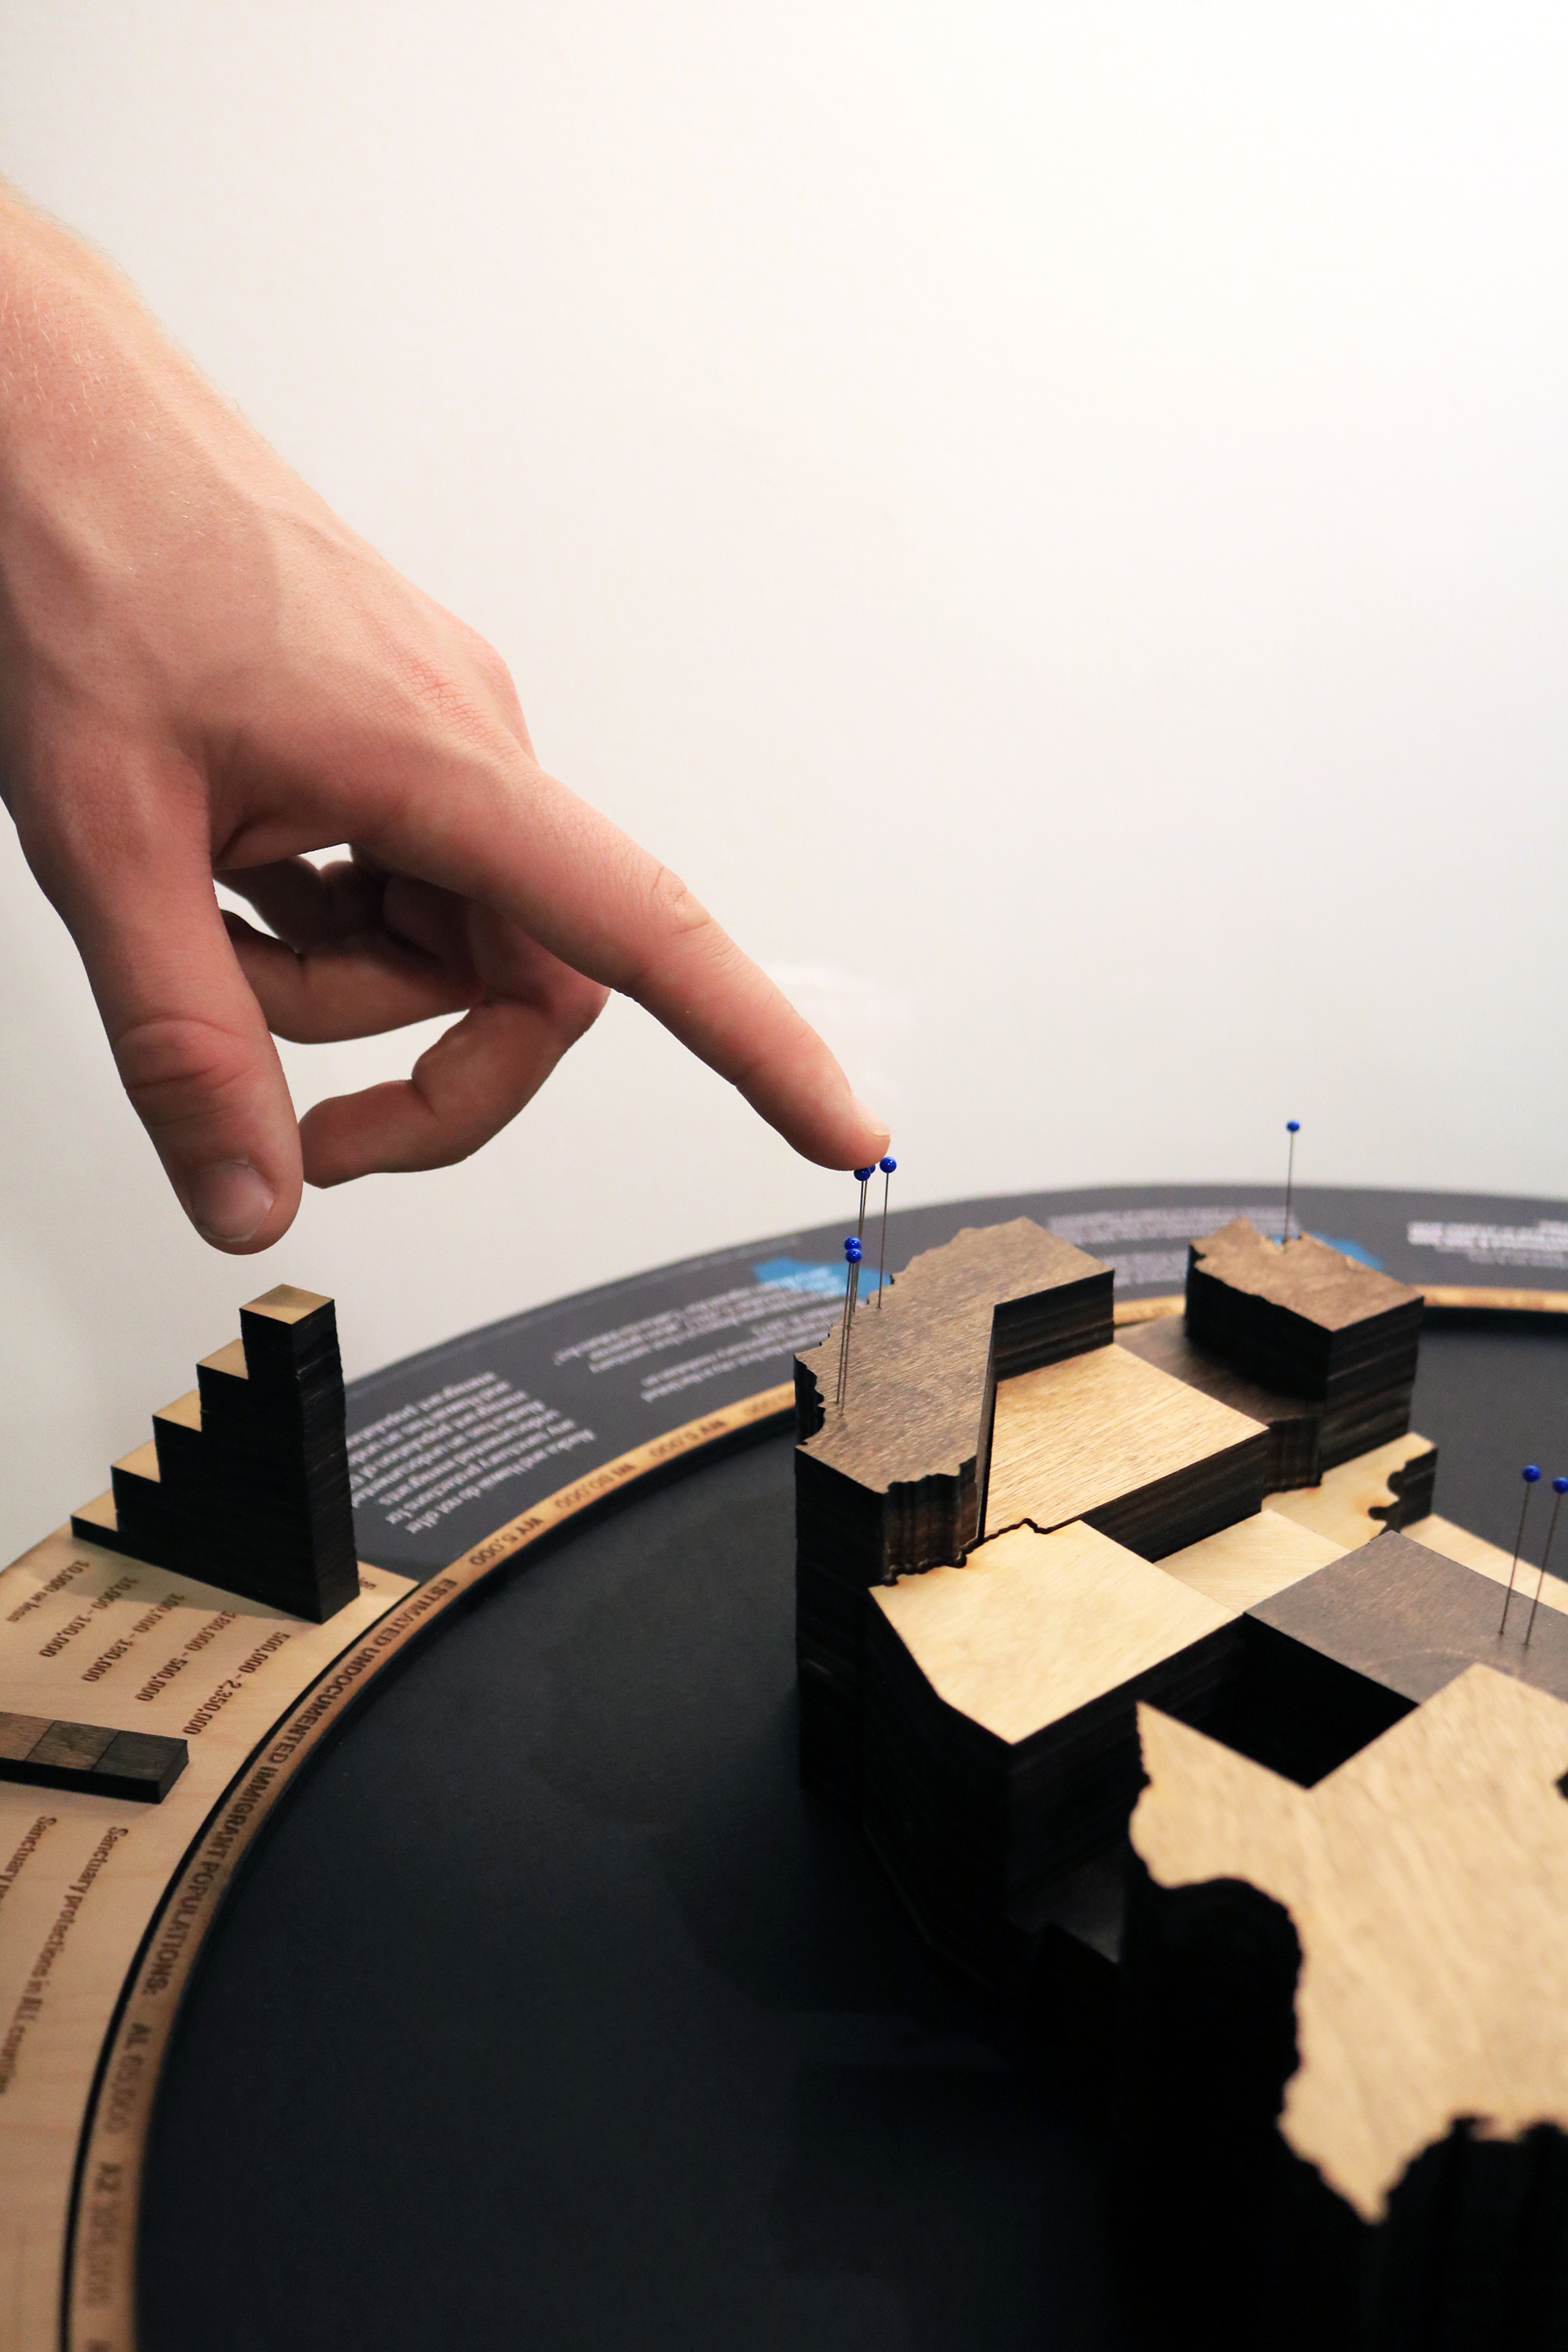


VCD 10 | Data Visualization For my data visualization class, we were asked to create 3-D installation that would illuminate one of the issues surrounding immigration. The project was a collaboration with my classmate Nico Limacher. We chose to research sanctuary cities and explore coverage that is provided for undocument immigrant populations across the United States. As indicated by the key, the height of each state represents undocumented immigrant populations, and the stain represents protection levels (the darkest stain indicating states with full coverage). Specific population numbers can be found on the wooden ring, and sanctuary cities are called out by the blue pins. Because this piece would hypothetically be found in an exhibition, we didn't want people to be locked into the one, traditional viewpoint of the United States. To accomplish this, we laid out the text in a way that would prompt viewers to walk around the entire thing.


