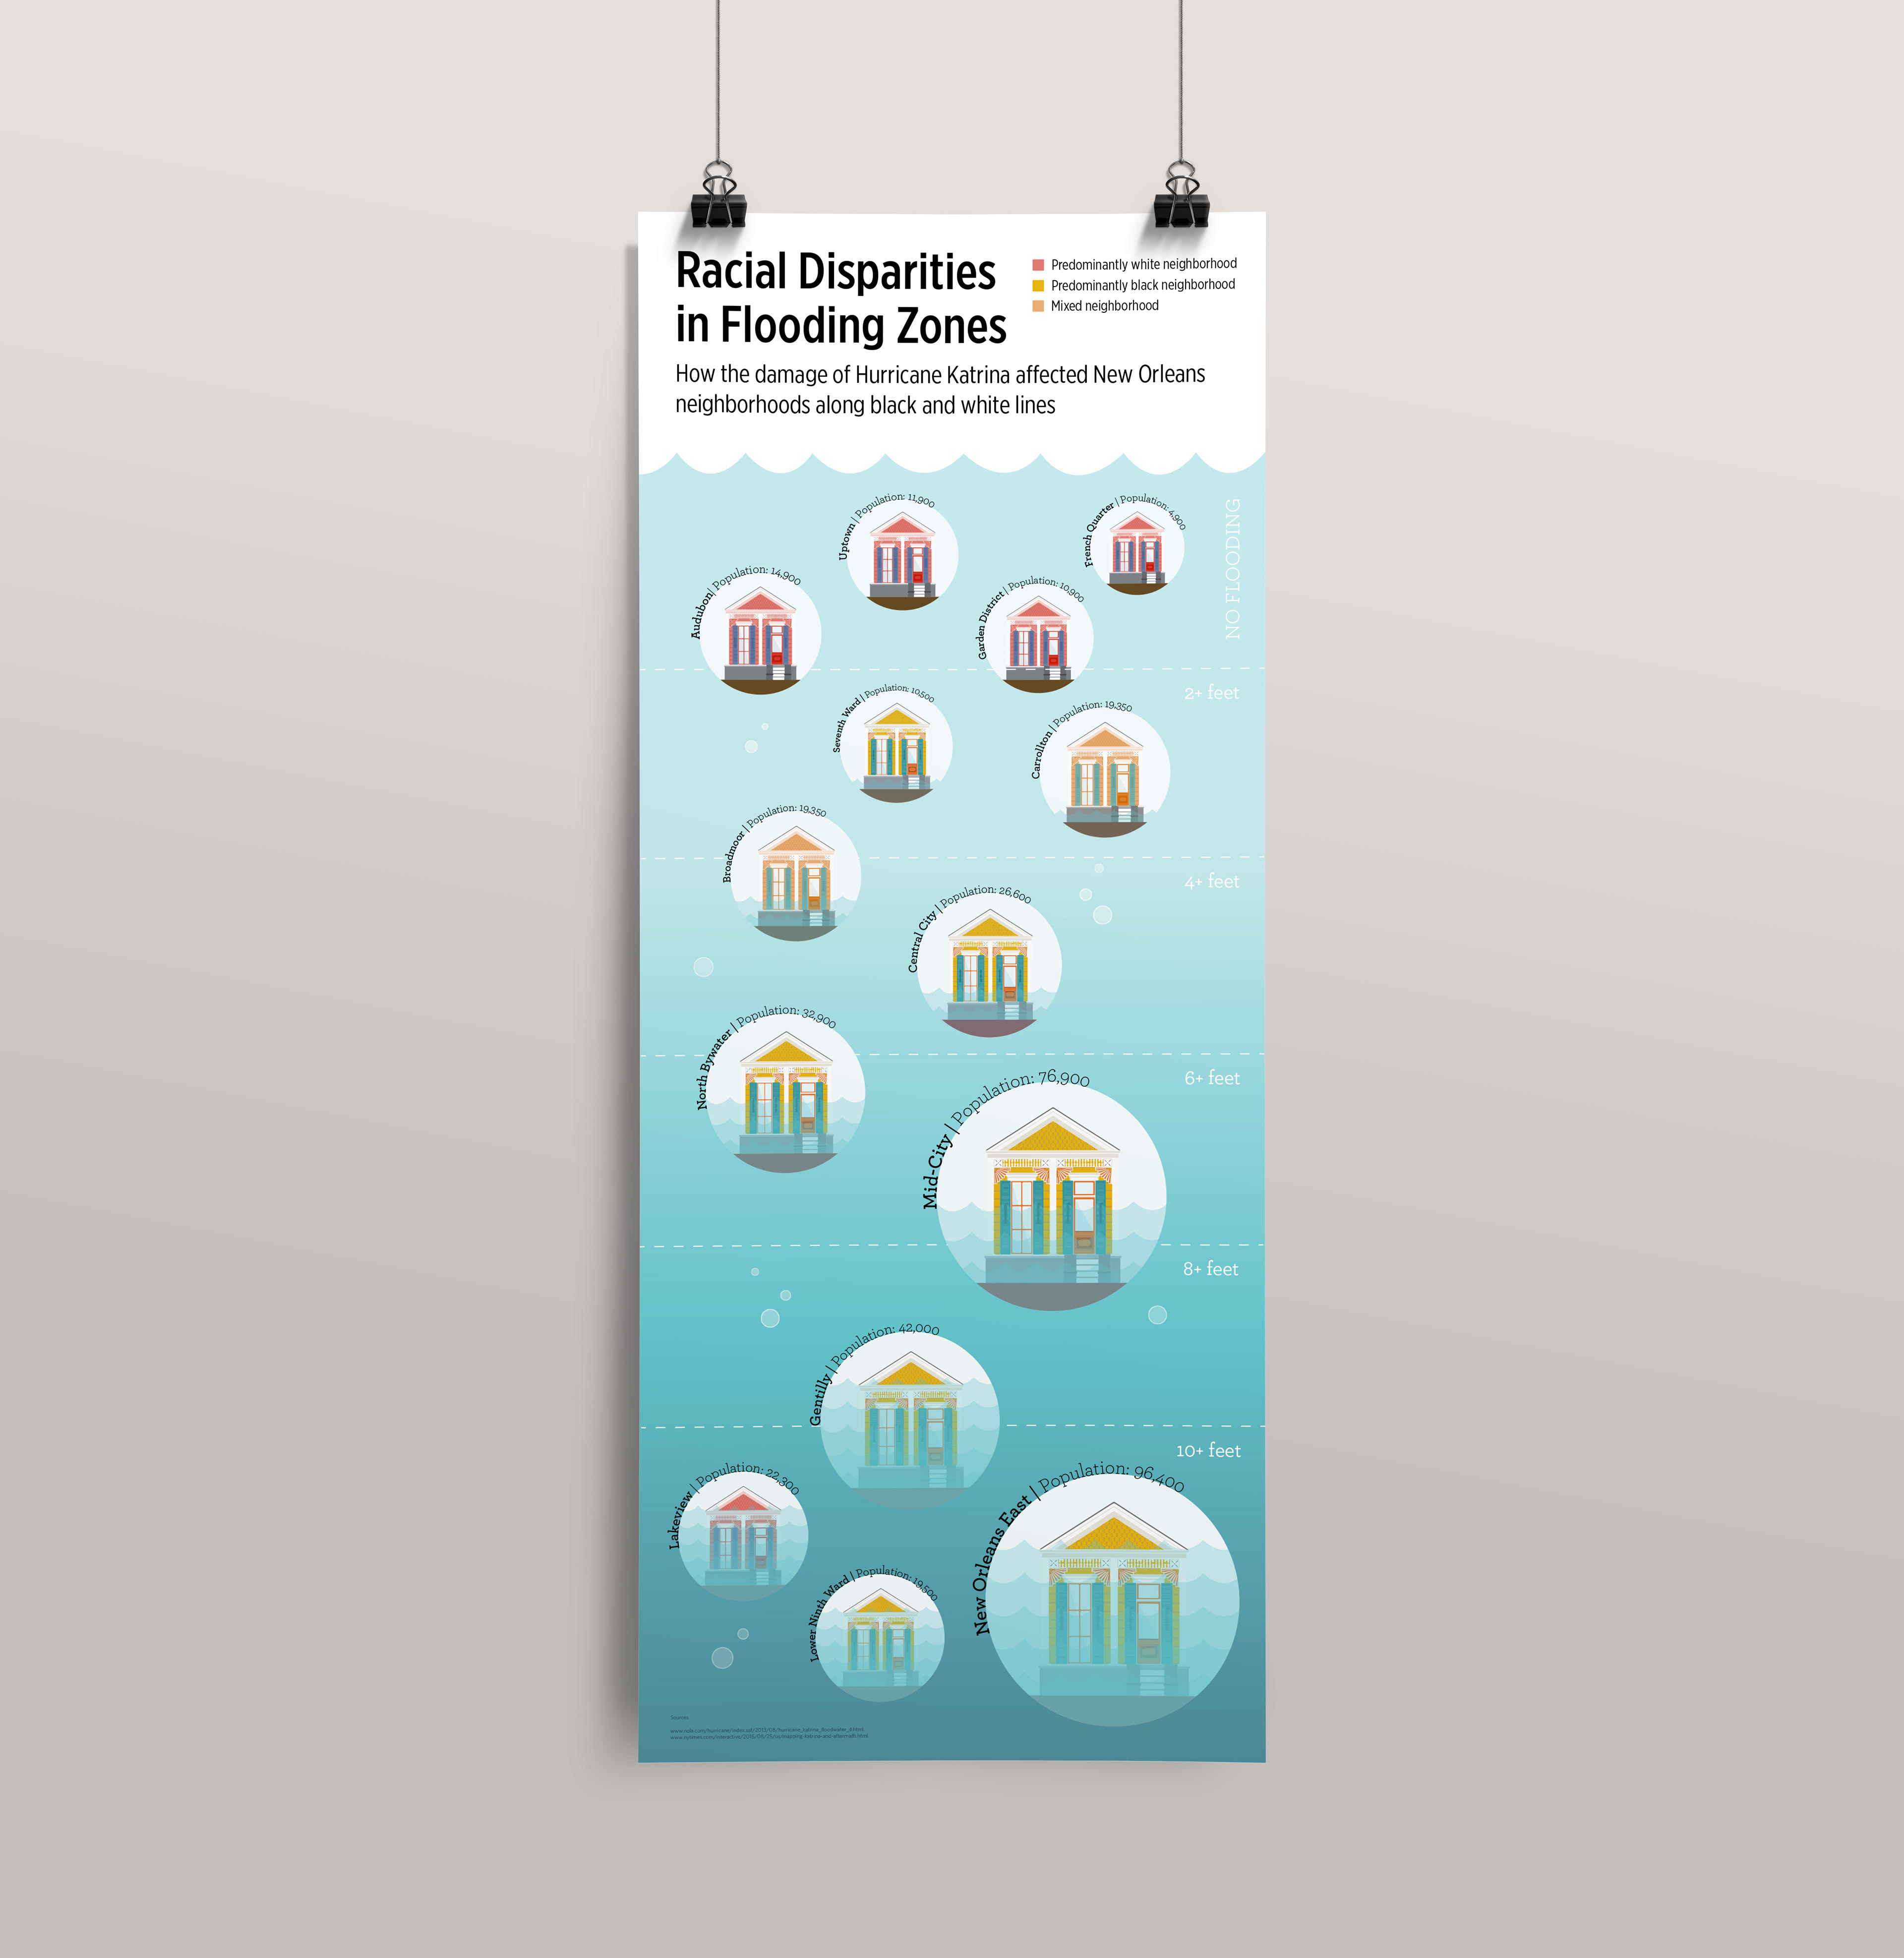

VCD 10 | Data Visualization Tasked with creating a data visualization that would convey an "a-ha moment" related to race and ethnicity, I was immediately reminded of the United States government's response in 2005 following Hurricane Katrina and wanted to research and explore this in more depth. What resulted is a visual representation of the various New Orleans neighborhoods and the obvious difference in floodwater depth for predominantly black versus predominantly white neighborhoods.